
 By
By 
Expert TA’s online homework system offers the most symbolic questions on the market, and they are graded as more than simply right or wrong. This partial credit grading, along with sophisticated feedback provided to students, leads to usage data that is examined in an offline service called Expert TA Analytics.
As described in an earlier post, we utilize this data in ways that allow us to continually develop our product. This began with an effort to develop sophisticated, human-like feedback. In a massive exercise in data mining, every wrong answer for each question in the Expert TA system is extracted, processed and consolidated. Through partnerships with PhD-level physics instructors, each of these incorrect submissions is reviewed, and specific and targeted feedback is provided.
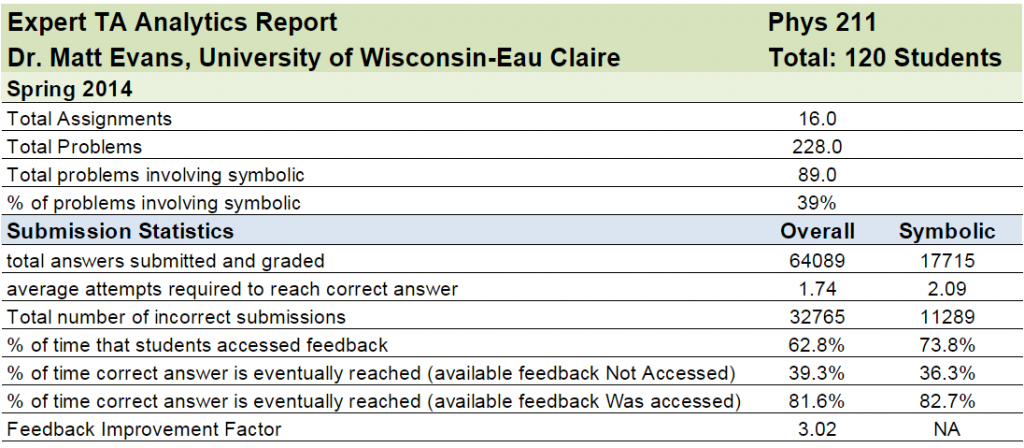
Expert TA Analytics is part of a 4-year data mining initiative designed to show how students interact within our online homework system. In this post, we will discuss how the Analytics platform is beneficial for both instructors and students by reviewing data from one of Dr. Matt Evans’ courses at the University of Wisconsin - Eau Claire. You will see portions of an actual Analytics report from Dr. Evans’ course, starting with the overview area below.

In this overview area, you can see that Dr. Evans’ class had 120 students, and he created 16 assignments including a total of 228 questions. Approximately 40% of those problems involved some sort of symbolic question requiring students to engage in the problem-solving process, showing their work as they would on an exam. Overall, there were over 32,000 incorrect answers submitted, and as a result, students were presented with meaningful feedback. When they accessed this feedback, their rate of reaching a correct answer went from 39.3% to 81.6%, more than doubling their chances.
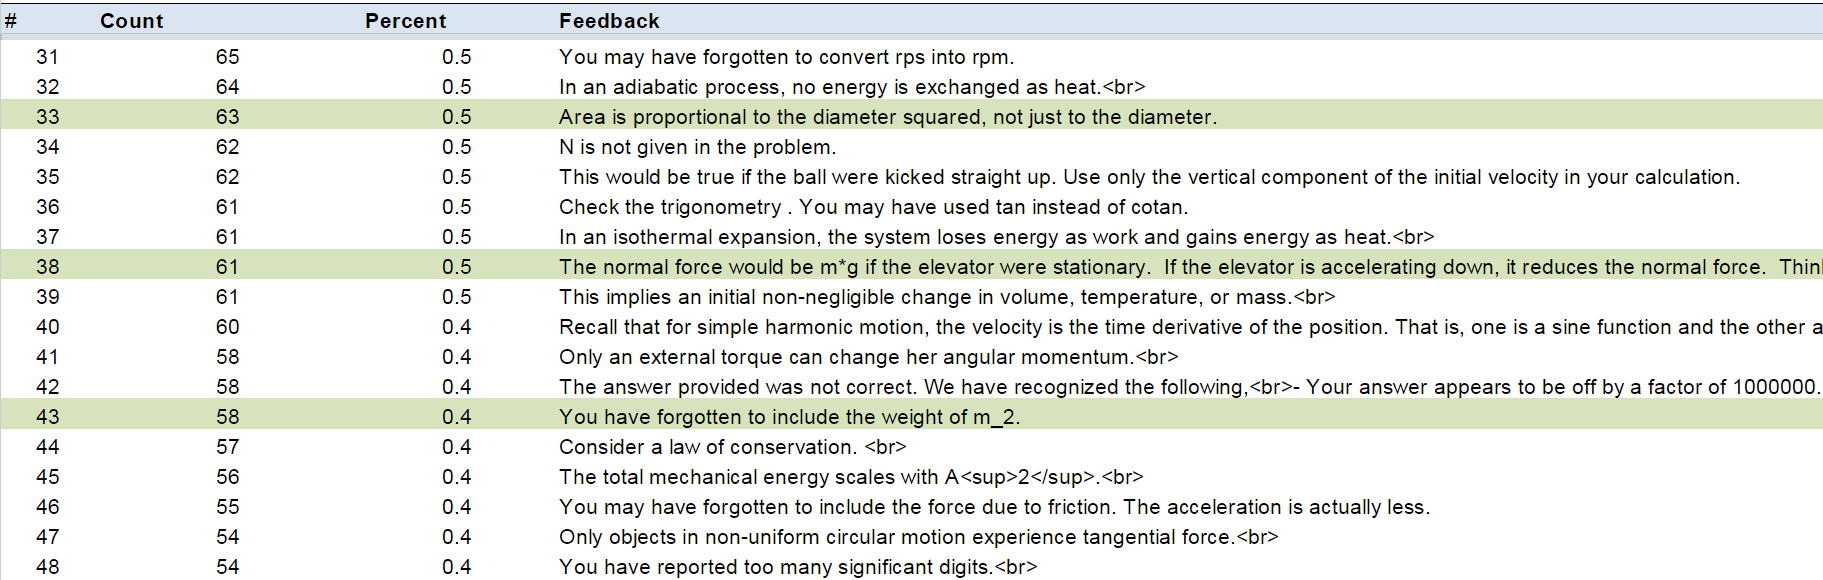
In each report, the data is parsed in a variety of useful ways. One way, shown below, provides the total feedback count from all assignments in the course. In this view, the feedback is sorted with the most commonly occurring feedback on top, and information is provided about how often each unique feedback statement was generated.
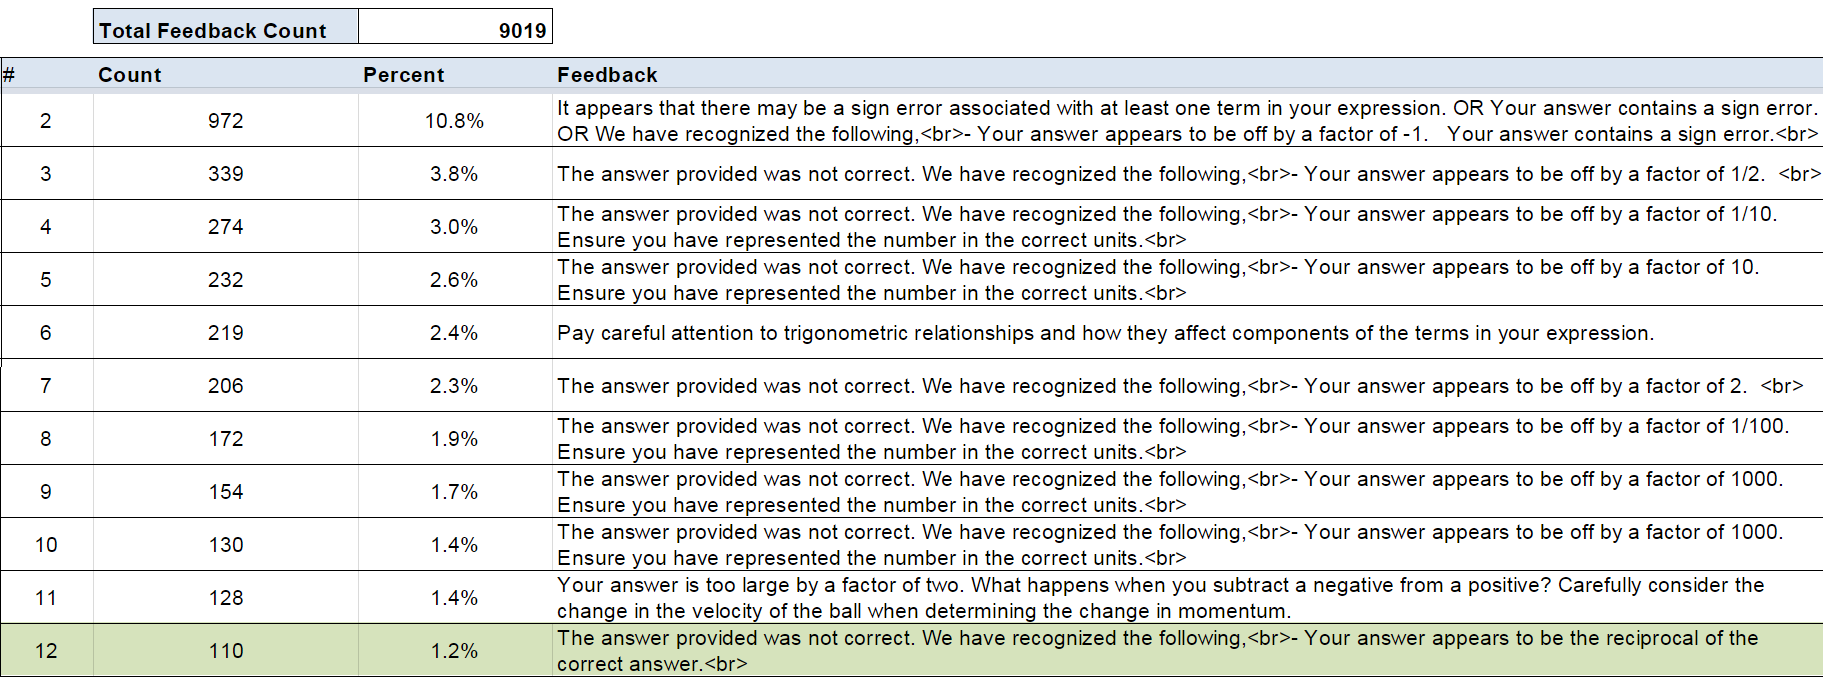
Throughout the semester, there were over 9,000 instances of feedback for this class of 120 students. The feedback occurring most often tends to be related to mathematical errors such as sign errors, trig errors, incorrect units or being off by a certain factor, because these errors can occur across all chapters or topics. Moving down the list allows instructors to see feedback that is specific to only a single problem or topic.
Dr. Evans shared his thoughts on Expert TA’s feedback, saying:
I use the program as a learning tool, allowing the Expert TA program to help students immediately obtain direct feedback. Allowing students to immediately see this detailed feedback clearly shows that it helps them overcome their misconceptions and obtain the correct answers at a rate three times higher than without the feedback.
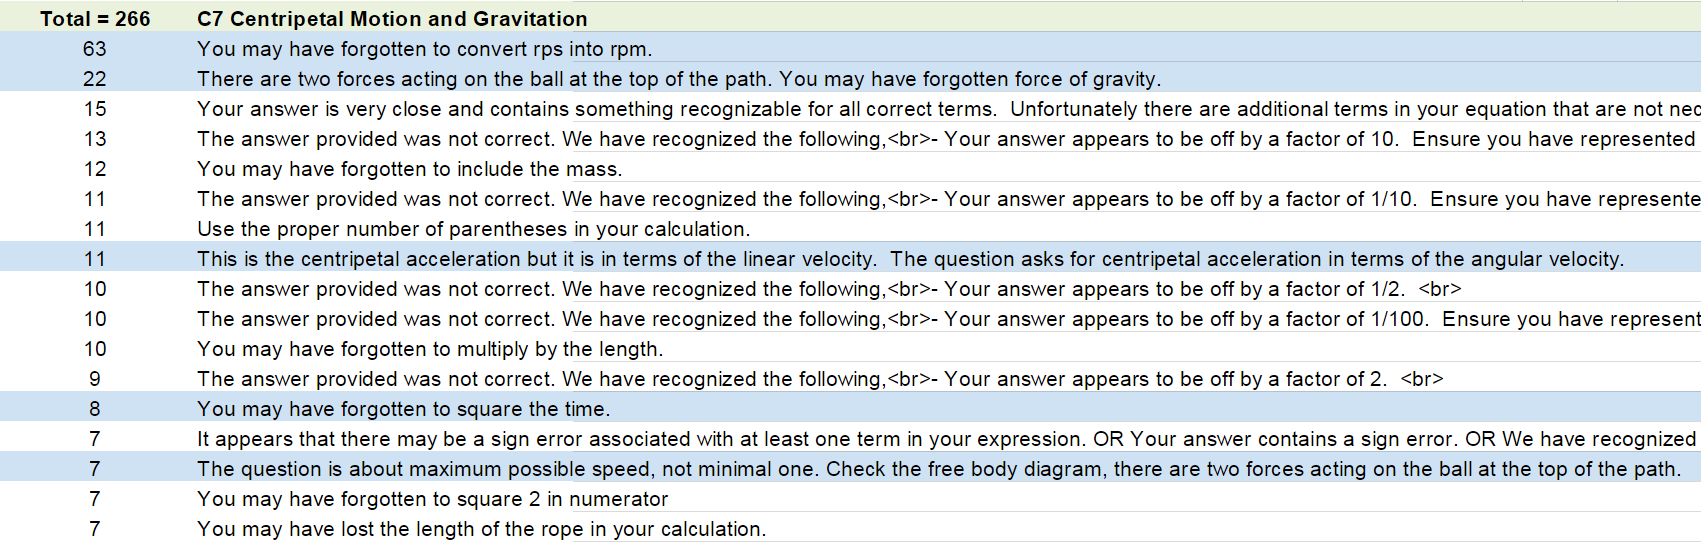
Expert TA Analytics also organizes data on the assignment level. Below, you can see that in an assignment entitled “C7 Centripetal Motion and Gravitation,” there were 266 items of feedback. The instructor can quickly identify the most common misconceptions and proactively address them when going over certain chapters or topics in subsequent offerings of the class.
Dr. Evans concludes that the assignment view included in the Analytics report gave him valuable insight:
Seeing the most common feedback helps me see where I can enhance my lectures. For instance, in Chapter 7, I might show a simple example converting radians per second to revolutions per minute at the end of a problem, as almost 25% of my class made this error.
The information above illustrates how the level of detail and organization of data in the Analytics platform can allow for meaningful study of trends in student learning. In an effort to investigate these trends on a larger scale, Expert TA conducted a massive case study involving 120 classes, cross-referencing information such as that presented for Dr. Evans’ class. A similar result was observed related to the high success rate experienced when students accessed meaningful feedback. Across the 120 classes, involving almost 1,200 assignments and 2.5 million submitted answers, the rate at which students reached a successful outcome jumped from 20% to 85% when they chose to access the available feedback. Many of these 120 instructors partnered with Expert TA and correlated the homework analytics data with all other grade information for the class. Overwhelmingly the Expert TA homework grades highly correlated to the grades students earned in other elements of the class.
Physics education researchers are always confronted with the challenge of collecting enough data for studies to be considered statistically significant. Faculty who have worked with Expert TA during the initial launch of the Analytics platform are excited about the promise that this tool can offer in the search for uncovering trends in student learning.
If you are a physics education researcher, or just a thoughtful instructor who cares about student learning, feel free to contact us to learn more.
Formed from the belief that a homework system should help instructors teach and students learn, Expert TA harnesses the power of technology to encourage practice during homework, while also giving meaningful feedback to both instructors and students. The Expert TA blog was created to serve as a hub of information to help educators track and discuss trends in education, software and student performance. Stay in-the-know by signing up for the Expert TA newsletter.
